When conducting market research, you need to follow a structured step-by-step approach to collect, analyze, and interpret information about a specific market, consumers, and competitors to make informed decisions. The process involves steps designed to understand the market research purpose, identify opportunities, assess risks, create strategies, and take action. Businesses can use insights from the market research to understand their target audience and identify growth areas. This guide covers the different steps to take when performing market research.
Steps to Conducting Market Research
The steps to conducting market research include creating a research question, choosing your research methods, collecting the data, analyzing and interpreting, presenting your findings, and taking action. Let’s look at each step in detail:
1. Clearly define your research question
When conducting market research, defining your research question or problem ensures that the market research is focused and delivers actionable insights. To do this, first understand the purpose of the study. Why do you need it? There are different reasons why companies carry out market research. For some, it could be to introduce a new product in the market or evaluate the success of a product; for others, it’s about analyzing their competitors or understanding customer behavior. For example, a business creating a gym app might want to know about its competitors. Once you understand the purpose, you can formulate the research question.
The next step is to come up with the research question. The question should cover the primary issue you want to address. Use the SMART framework to form a comprehensive question.
- Specific help you define the area of interest
- Measurable ensure you factor in quantifiable data collection and analysis in the question.
- Achievable ensures the question is realistic and you have enough resources to get an answer.
- Relevant ensures the question aligns with your business objectives.
- Time-bound means setting a specific timeline for obtaining and using the results.

An example of a SMART research question is:
What features and functionalities do the top five gym apps in Canada offer, and how can we design a new gym app that incorporates unique value propositions to surpass competitors and capture 15% of the market within the first year of launch?
After setting the research question, break it into goals and objectives. For example, the goal is to design a gym management app with a unique value proposition that surpasses competitors. Break into actionable steps:
- Identify the strengths, weaknesses, and unique offerings of leading gym management apps
- Highlight unmet needs in the gym management app market
- Outline the features and tools that will set your app apart
Collaborate with colleagues, partners, market researchers, or other relevant stakeholders to refine the research question. Get their perspectives to ensure you are on the right track. Document the research question, including the goals and objectives, to serve as a reference throughout the research process.
2. Choose your market research method

Once you’ve decided what to research, choose the best research method to help achieve your goals. The first thing to do is establish a budget. How much funds and resources are you willing to use? For example, if you choose to do a survey, determine the financial resources to purchase survey tools and data analysis software and even compensate the respondents. A budget helps to determine the feasibility of the study and prevent overspending.
Next, develop a research prediction statement that reflects the outcome you envision. For example, customers prefer glass bottles of essential oil over plastic bottles. This statement guides your research focus, helping you develop questions or other methods you choose for the research. Also, external influences such as environmental changes or economic conditions may affect the research. For example, if you research consumer behavior, Los Angeles won’t be the best place to do so, as the current wildfire could skew results.
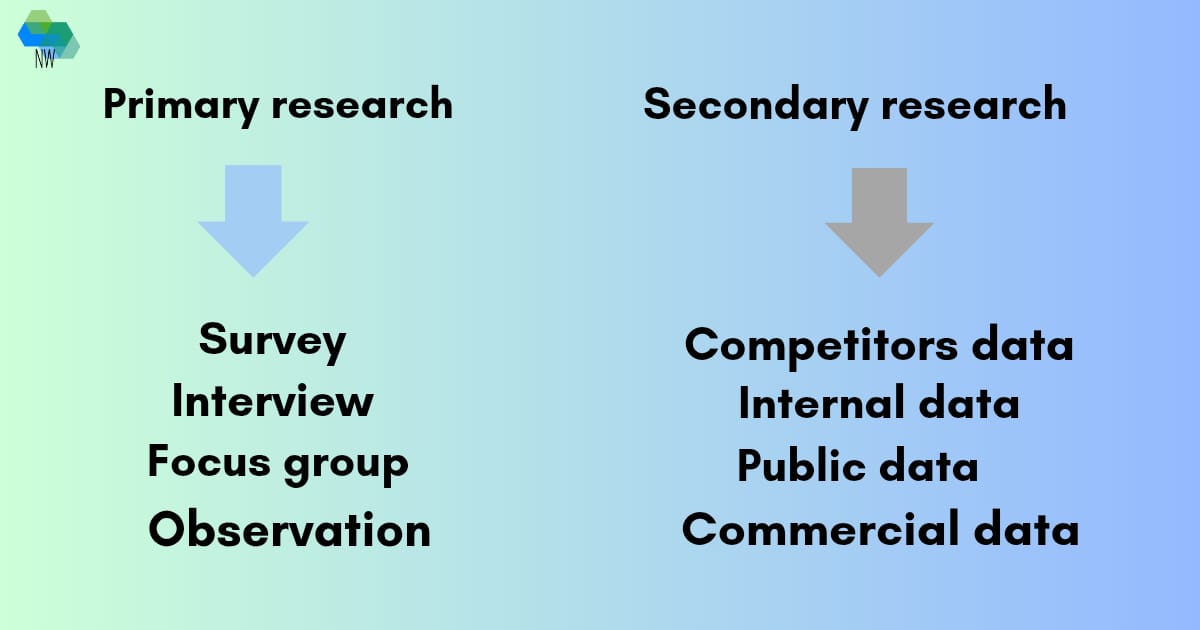
Now that you have your budget and hypothesis, it’s time to choose a market research method. You can select surveys, interviews, focus groups, and internal or public data. Remember that your preferred method will depend on your business goals, budget, and other factors.
After this, determine the sample size and the number of participants you need to ensure your results are reliable. You can use sampling techniques such as random, stratified, and convenience sampling. Random sampling means everyone can participate, whether male, female, young, or old. The stratified sampling divides participants into groups, such as male or female-only participants. Convenience sampling uses participants who are readily available for the research.
3. Collect the data

The next step in conducting market research is the data collection. This step provides the information needed to answer the research question you’ve created and provides accurate and meaningful insights.
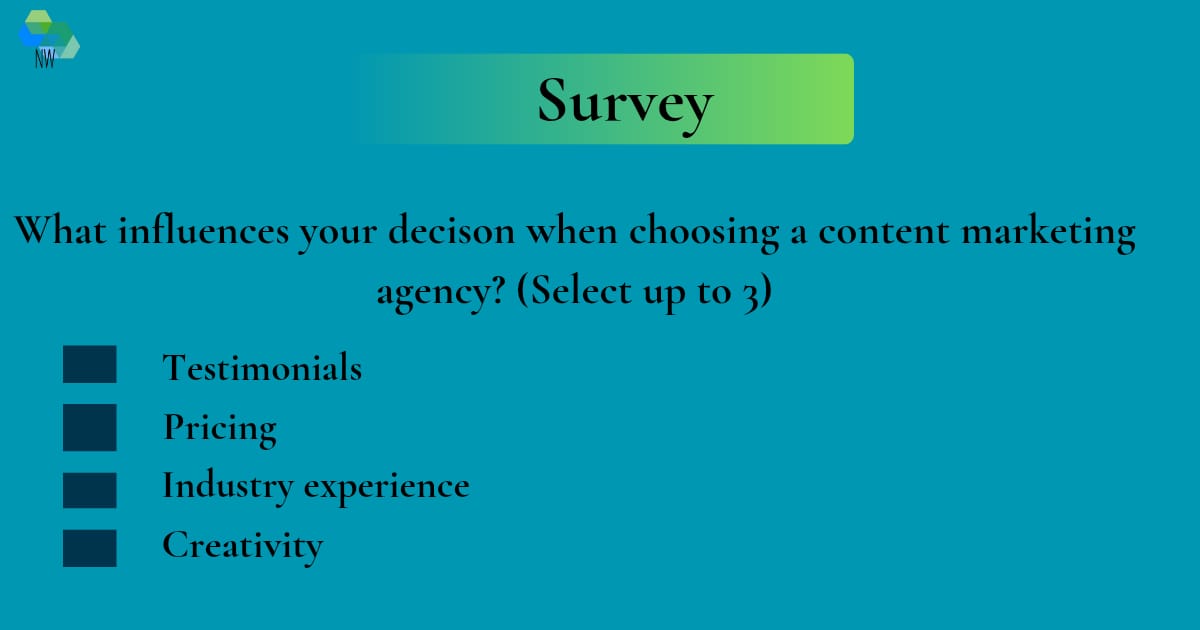
If you choose a survey method, design the questions carefully to get accurate data. Avoid rushing this step, as it’s crucial in the research survey process. Ask clear and relevant questions that respondents can understand. Use open-ended and close-ended questions to get a balance of qualitative insights and measurable data. Most importantly, keep it concise. Avoid asking many questions to encourage respondents to complete the survey and reduce the risk of dropouts.
Frame questions so you can effectively analyze them and choose a sampling method that fits your target audience. Before sending out the survey, test it with a small group of respondents, probably your family and friends, to ensure the questions are straightforward and identical to technical issues and other potential problems.
Immediately fix any challenges before sending it out to a larger audience. If you’re going with the survey, consider using online survey tools, as they help distribute the survey efficiently through email, social media, and websites. It also helps gather and analyze responses.
4. Analyze the data

Data analysis involves identifying trends and patterns that can provide insights to answer your research question. This way, you’re making decisions based on evidence rather than assumptions.
To analyze your data, start by organizing it. Review the data to identify errors like duplicate entries or incomplete responses. Categorize the data into groups, for example, based on age, gender, and location. After grouping, it’s time to use the right tools for analysis. If you have used online tools like Google Forms and Survey Monkey, built-in analysis features such as graphs and charts exist. However, consider tools like Google Sheets, Excel or Tableau for advanced analysis.
When performing quantitative data analysis (numerical data) such as age and score, focus on metrics such as trends and patterns, averages and totals, and percentages and ratios. Look for consistent behavior or preferences when analyzing trends. For averages and totals, identify the average or total number of respondents who prefer a specific feature. Also, consider using percentages as it helps break down complex data to understand proportions. It’s easier to state that 70% of users prefer red wheels over white than 350 out of 500 users like it.
Correlations are another metric to use when analyzing numerical data to identify relationships or connections between two factors. For example, connecting user demographics with app feature preferences can help customize offerings to specific groups.
When analyzing qualitative data (non-numerical data) such as beliefs, experiences, and motivation, use thematic, sentiment, and categorization analyses. The thematic analysis identifies recurring ideas, concerns, or themes respondents express. Sentiment analysis gauges the emotional responses or opinions, which could be positive or negative, while categorization creates groups for similar responses for easy analysis.
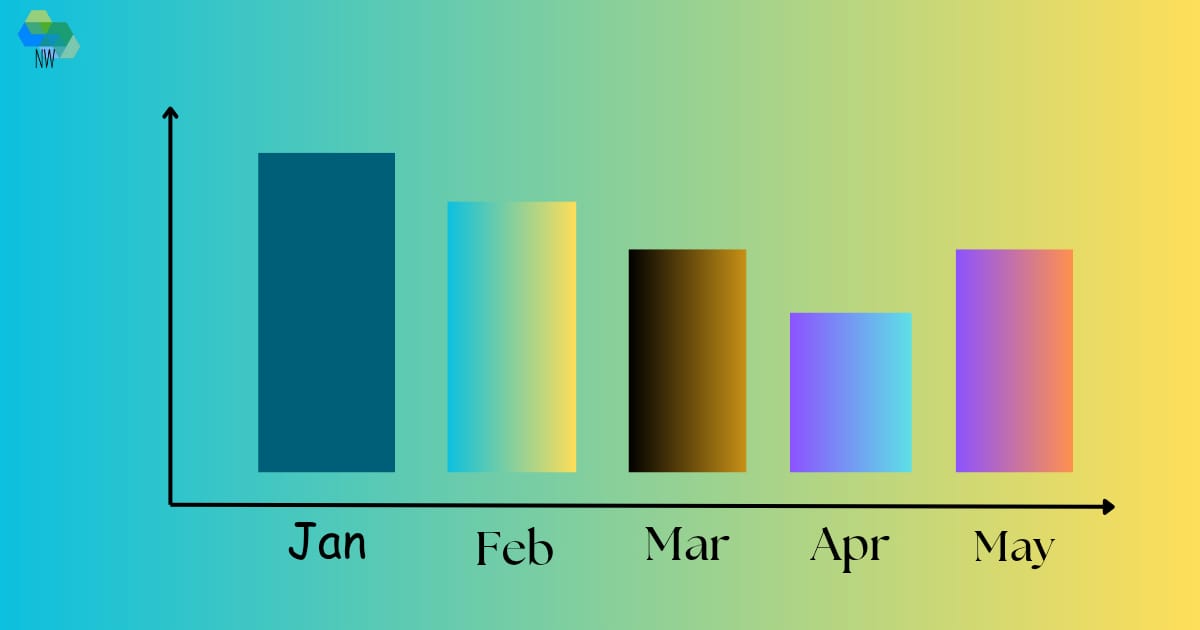
The next step in analyzing your data is visually presenting your findings, making them easier to interpret. Use graphs, tables, or charts for quantitative data and diagrams or word clouds for qualitative insights. Lastly, validate your research findings by checking for biases and cross-referencing findings with secondary data to ensure accuracy.
6. Interpret data results

It’s time to check if the findings align with your research question. Yes, the research question you created at the beginning of the research. Did you get information that answered your question? For example, if the question was, who are Canada’s top content marketing agencies, did the data reveal them?
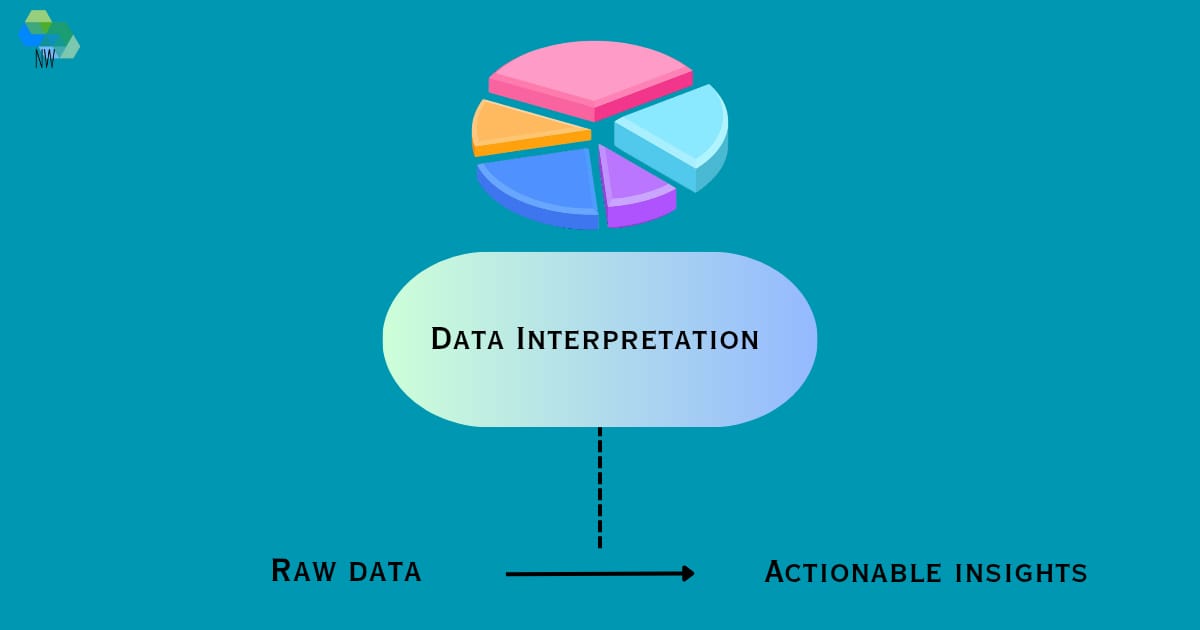
Interpreting your results involves translating data into actionable insights that align with your business objectives. By identifying the needs or opportunities from your research, you’ll know how to position your business to fill those gaps.
The first step in this process is to revisit the SMART research question you created, check if the data answers it, and then highlight major takeaways such as common pain points or frequently requested features the respondents pointed out. If you want to learn more about your competitors, highlight the gaps and point out opportunities for your business to surpass competitors.
Next, convert the findings to business strategies. You can use the insights during product development to prioritize features and functionalities. It’s useful for pricing strategies to ensure your pricing aligns with customers’ willingness to pay and market expectations. They are also valuable for marketing campaigns to help create messages that highlight the unique selling points of your products or services.
Next, create a comprehensive market strategy to define your target audience, positioning, and implantation plan. Create demographic and psychographic customer segments using the data you’ve analyzed, establish a UVP, and set timelines for strategies, whether marketing campaigns or product development.
7. Present your findings and take action

The final step in conducting market research is establishing credibility, reporting findings, making recommendations, and taking action. In the report, outline the research process by explaining how you conducted the research, data collection method, sample size, and analysis technique. Point out how you ensured the data’s validity and reliability and avoided biases.
Example: Our research included surveys of 650 gym owners in Edmonton, competitor feature benchmarking, and secondary analysis of industry reports. We tested the survey questions with a small group of people first to ensure accuracy and clarity before distributing them to a larger group.
The next step is to communicate your results with a report summary that assembles your findings and strategies clearly and concisely. Use headers to break findings into sections to improve readability. Include headers like an executive summary that highlights key findings and recommendations. Other headers include customer preferences, market opportunities, and competitor analysis. Use visuals like charts and infographics to present your data.
Customize your presentation to stakeholders such as the leadership, marketing, and technical teams. For example, let the leadership team know how your findings can lead to revenue opportunities or increase customer retention. Outline recommendations to identify potential risks and challenges so that they can decide on mitigation strategies. Show how implementing the recommendations can differentiate the company from competitors and increase market share. Rank recommendations based on their feasibility and impact on business goals. Also, ensure your report is accessible to non-technical stakeholders.
End the report with a call to action for the stakeholders. For example, “We recommend convening a marketing team meeting to finalize the strategies for pre-launch campaigns. Identify the teams that will manage the following steps and assign responsibilities. You can deliver findings through written reports and PowerPoint presentations.
Finally, turn recommendations into a strategic plan. Create timelines and milestones. Use relevant metrics to monitor and measure the success of implemented strategies.
Please note that none of the companies mentioned in this guide is affiliated with Nenye Writes.
Managing product development and making critical business decisions can leave little time for in-depth market research. That’s where we come in. Our expert team delivers the insights to stay ahead of the competition while you focus on growing your business. Let us handle the research so you can confidently make informed, strategic decisions. Partner with us today and turn data into your competitive advantage!


